Simpler Trading – Earnings Analysis Indicator
Description of Earnings Analysis Indicator
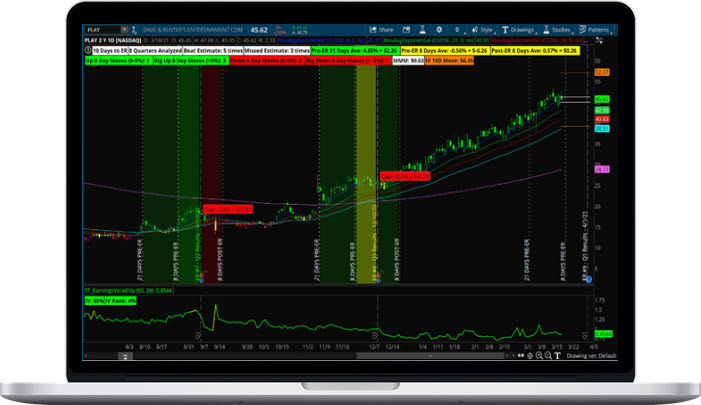
The Earnings Analysis Indicators does all the heavy-lifting for you each earnings season. By simply plotting the indicator, it calculates a multitude of different stats surrounding the particular symbol.
What will you learn?
Earnings Gaps
- Number of gaps over set time frame
- Average percentage/$ gap up
- Maximum percentage/$ gap up
- Number of gap downs
- Average percentage/$ gap down
- Maximum percentage/$ gap down
Pre-Earnings Price Movement
- Average percentage/$ move, XX trading days before and earnings reportthat resulted in a move higher after the report
- Average percentage/$ move, XX trading days before and earnings report that resulted in a movelower after the report
Post-Earnings Price Movement
- Average percentage/$ move higher XX trading days after the earnings report
- Average percentage/$ move lower XX trading days after the earnings report
More courses from the same author: Simpler Trading


