Wyckoff Analytics – Basic Charting Course
This course presents a wealth of foundational chart-reading knowledge, encompassing both Technical Analysis (TA) and the Wyckoff Method. You will learn elemental to intermediate charting principles, including our personal interpretations of conventional (TA) concepts within a Wyckoff Method context. The Basic Course focuses on the essential analytical techniques that will allow you to make a seamless transition from TA to the Wyckoff Method!
What You’ll Learn In Basic Charting Course?
Types of Charts: Vertical (aka Bar), Candlestick, Point & Figure (P&F), Candlevolume
- Descriptions and visual explanations of each type, including appropriate usage contexts and benefits
- Vertical bar (+ volume bars) – Tape Reading
- Point-and-Figure – companion to vertical charts, horizontal counts, less price volatility (not time), tape reading, volume
- Candlestick – Basic structure + visualizations
- Candlevolume charts – Combining candlestick + volume
Time Frames: intraday, daily, weekly, monthly
- Traditional timeframes and how they are best used. Campaigns (weekly + monthly), swing (daily), intraday (intraday + daily)
- Combining multiple timeframes
- Price and volume patterns are fractal on different time frames
The Market as a Discounting Mechanism and a visual representation of campaigns actions conducted by the Composite Operator (CO)
- Technical Analysis reveals the Discounting Mechanism. Definition. Long-term trend initiation, with catalyst(s) appearing later on.
- The Composite Operator as a heuristic for institutional participation
Cyclicality vs the Price Cycle
- Technical Analysis Cyclicality. 3-5 year business cycle
- Business cycle corresponds with the market cycle
- Wyckoff Price Cycle: Accumulation, Mark-up, Distribution, Mark-down
Trends and trading ranges within Price Cycle
- Price Cycle sequence: Accumulation, Mark-up, Re-accumulation, Mark-up, Distribution, Mark-down, Re-distribution
- Cyclicality of Price inside the channel
- Different time frames’ cyclicality and the Price Cycle
Trading Range: Support/Resistance, Breakouts, Failed Breakouts, Upthrusts (UT) and Springs/Shakeouts(SO) or Signs of Strength (SOS)/Signs of Weakness(SOW)
- Technical Analysis: Trading ranges explained
- Technical Analysis: Support and resistance defined
- Technical Analysis: Breakouts and failed breakouts
- Wyckoff: Support and resistance defined
- Wyckoff: UT and Spring/SO as failed breakouts + SOS/SOW as successful breakouts
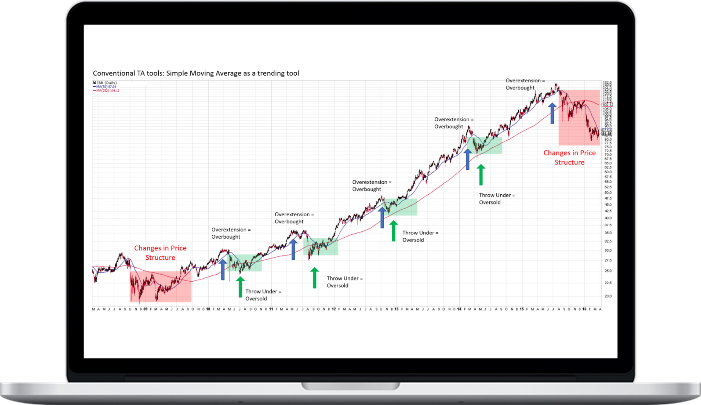
Trends: Definition – Higher Highs(HH)/Higher Lows (HL). Logarithmic vs arithmetic scales. Moving averages (MA), Linear Regression Line (LRL)
- Technical Analysis: Trend Definition. HH/HL for uptrends and the reverse for downtrends
- Comparison of logarithmic vs arithmetic scaling
- Technical Analysis: Trend defined by TA tools (MA, Linear Regression Line)
- Wyckoff: Also HH/HL
Trends: Conventional and Reverse Trendlines. Break of trendlines/Change of Character (ChoCh)
- Throw-overs and Oversold/Overbought conditions
- Break of Trendline signal. TA vs Wyckoff CHoCH
- Visuals: Multiple examples
Price formations: Technical Analysis Patterns
- Reversal vs continuation patterns
- Trading ranges, including triangles, flags and pennants, wedges
- Triangles of different kinds compared with Wyckoff’s Hinge or Apex
- Head & Shoulders, inverse patterns, double tops and bottoms,
- Parabolic, V-formations or spikes
- Rounding top/bottom formations
Wyckoff Price Formations: Accumulation
- Accumulation Events: Selling climaxes, secondary tests, springs, and others
- Accumulation Phases. Predictable sequences of Accumulation events
Wyckoff Price Formations: Distribution
- Distribution Events. Buying climaxes, secondary tests, UTs, and others
- Distribution Phases. Predictable sequences of Distribution events
Basic Technical Analysis definitions
- Volume leads price.
- Volume confirmation of price, with examples. Volume as evidence of Demand or Supply (or both).
- Volume divergence from price (non-confirmation), with examples.
Wyckoff Laws: Supply and Demand
- Wyckoff’s Law of Supply and Demand drives the Price Cycle. Example: Exhaustion of Supply in a trading range leads to an uptrend.
- Case study: Price Cycle resulting from changes in Supply and Demand
Wyckoff Laws: Effort vs. Result
- Effort vs. Results law. Definition.
- Result in line with Effort
- Non-confirmation. Result not in line with Effort.
Wyckoff Comparative analysis
- Original Wyckoff Course comparative visuals
- Basic construction and interpretation
- Significant highs and lows + slope
- Issues with comparative analysis
Relative Strength (RS) analysis
- Definition and basic construction
- Basic interpretation
- Heat Map ranking based on changes in RS
Technical Analysis Indicators useful to Wyckoff Traders. Rate of Change (ROC), Relative Strength Index, Stochastics, and On Balance Volume (OBV)
- Volume: OBV
- Momentum: ROC
Basic Technical Analysis P&F concepts (vertical measurements)
- One of the oldest charting methods
- P&F breakout patterns
- Vertical price objectives
Wyckoff P&F Basics (horizontal counts)
- Wyckoff’s Law of Cause and Effect
- Basic horizontal counting guidelines to determine price targets
- 1-box (swing) vs 3-box reversal (campaign)
- Intraday P&F counts examples
More courses from the same author: Wyckoff Analytics


