No products in the cart.
Return to shop
Showing the single result
You need to assign Widgets to "Shop Sidebar" in Appearance > Widgets to show anything here
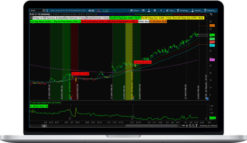
Simpler Trading – Earnings Analysis Indicator
Username or email address *Required
Password *Required
Remember me Log in
Lost your password?
Email address *Required
A link to set a new password will be sent to your email address.
Your personal data will be used to support your experience throughout this website, to manage access to your account, and for other purposes described in our privacy policy.
Register